
Prior Authorization Delays: What They Actually Cost And How to Fix Them
- Payal Patwal
- 7 hours ago
- 10 min read

Most Teams Working on Prior Auth Aren't Failing Because of Bad Ideas — They're Failing Because They're Measuring the Wrong Things.
You already know prior authorization is a problem. Your staff knows it. Your physicians know it. The patients sitting on hold know it.
But knowing it and fixing it are two different things. And most organizations stay stuck in the middle — aware of the pain, unsure where it actually starts, and unable to build a case strong enough to change how the work gets done.
That's what this post is for.
Prior auth touches three things your organization cares about most: patient access, revenue, and staff capacity. When it breaks down, all three suffer at once. The goal here is to give you a way to see that clearly — in numbers, in workflows, and in a 30-day plan you can actually start.
If you lead clinic operations, prior auth delays show up as unused slots and frustrated patients
If you lead revenue cycle, they show up as write-offs, denials, and slow cash
If you lead value-based care, they show up as missed care windows and preventable utilization
The fix starts with measurement. Not better intentions — measurement.
What Prior Auth Is Costing You, Beyond the Labor Line
The first cost everyone sees is staff time. The bigger costs are harder to spot. They're spread across departments and recorded under different budget lines.
Break the impact into five categories. When you do, it becomes easier to align operations, finance, and clinical leaders around the same problem.
Your Staff Is Spending the Equivalent of Two Full Days a Week on This — Per Physician
The AMA's 2024 Prior Authorization Physician Survey studied 1,000 practicing physicians across the country. The findings are hard to dismiss.
Physicians and their staff spend an average of 13 hours per physician, per week, on prior authorizations. The average practice handles 39 requests per physician, per week. That's not a minor administrative task running in the background. That's a part-time job — running in parallel with clinical care, pulling attention away from patients every single day.
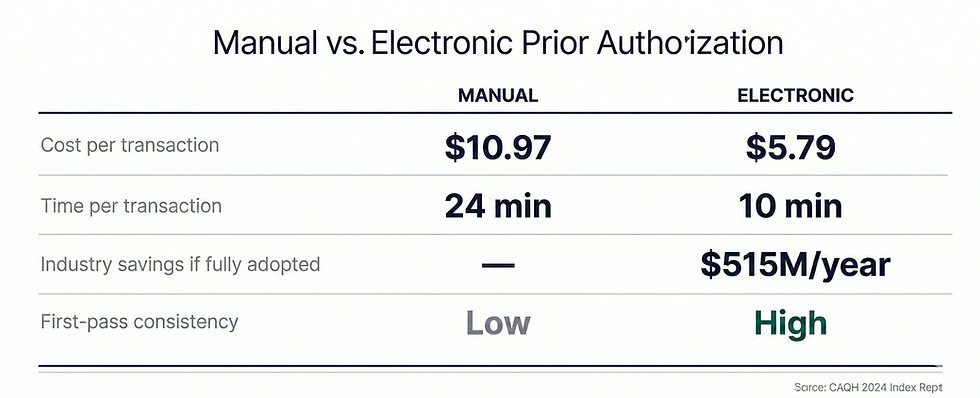
The CAQH 2024 Index puts a dollar figure on it. A manual prior authorization costs providers an average of $10.97 per transaction. A fully electronic one costs $5.79. If your organization runs 2,000 authorizations per month on a manual process, that's roughly $22,000 a month in transaction costs alone — before you count denials, rework, or schedule damage.
Shifting to electronic prior authorization could cut that cost nearly in half. That's a number that survives the budget season.
When a Prior Auth Stalls, Your Schedule Doesn't Just Pause — It Breaks
Slots get held while the authorization is pending. Most get released too late to refill.
This isn't just a patient satisfaction issue. It's a capacity planning issue. For imaging centers, infusion suites, and specialty procedures, one week-long delay can ripple into schedule gaps that take days to recover.
The AMA survey found that 82% of physicians say prior authorization sometimes leads patients to abandon their recommended treatment entirely. That's not a patient who reschedules. That's revenue that doesn't come back — and a patient whose care was delayed or stopped.
Many Denials Were Never Real Denials — You're Just Paying Twice to Find That Out
This is the part most organizations underestimate.
The HHS Office of Inspector General reviewed prior authorization denials from 15 of the largest Medicare Advantage Organizations. Their finding: 13% of those denials met Medicare coverage criteria entirely. Those requests should have been approved. They weren't.
And when providers did appeal, MA plans overturned approximately 75% of their own denials.
Think about what that means. Three out of four appealed denials were reversed. But most denials are never appealed — because the practice doesn't have the bandwidth. The AMA survey found that 53% of physicians skip appeals because patient care can't wait. Another 55% say they simply don't have the staff to do it.
So those denials quietly become write-offs. Or they become out-of-pocket costs for patients who shouldn't have paid anything.
Every denial should be categorized. Is it a medical necessity denial? A documentation error? A coding mismatch? An expired order? Until you know the breakdown, you can't reduce it.
For Value-Based Organizations, Prior Auth Friction Doesn't Show in Your Queue — It Shows in Your Year-End Metrics
For ACOs and Medicare Advantage operators, prior auth problems don't just hurt revenue in the near term.
They disrupt care gap closure. They delay post-discharge follow-up. They push patients toward the ED instead of a scheduled, managed visit.
None of that shows up in your authorization dashboard. But all of it shows up in your quality performance at the end of the year — and in your shared savings calculations.
The Regulatory Direction Is Already Set — Manual Workflows Are Getting More Expensive, Not Less
The CMS Interoperability and Prior Authorization Final Rule (CMS-0057-F), finalized in January 2024, requires affected health plans to implement FHIR-based APIs for prior authorization by January 2027.
The intent is clear. Move the industry away from fax and phone-based workflows. Reduce friction. Increase transparency.
For organizations operating in Medicare Advantage, this makes the case even more urgent. The OIG's findings about denial rates and overturn rates aren't a surprise — they're a signal. The organizations that modernize their prior auth workflows now, with better documentation and faster tracking, will be better positioned when the regulatory requirements arrive. The ones that wait will be playing catch-up under pressure.
Measuring and modernizing your prior auth workflow isn't optional hygiene. It's a durable operational capability you'll need — regardless of how payer policies evolve.
How to Measure Prior Authorization Like an Operations Leader
The reason most organizations can't improve their prior auth workflow is simple. They're not truly measuring it.
They might track volume. They might track denial rate. But they don't measure where time is actually lost, or how many human touches it takes to get one request across the finish line.
Here's a framework that works. Think of it in two layers.
Flow metrics show you where time is lost
Outcome metrics show you what it costs
Flow Metrics: Your Operational Truth
Track these for each major service line — imaging, infusions, surgery, specialty medications, DME — and then segment by payer.
Authorization volume: requests submitted per week, by service line and payer
Cycle time: order date to final determination — track median and 90th percentile separately
Queue time: order date to first submission — this isolates internal delay
Payer time: first submission to final determination — this isolates external delay
Touches per authorization: how many human actions occurred (calls, portal checks, faxes, resubmissions)
Touch time per authorization: estimated minutes per touch, multiplied by number of touches
First-pass yield: percentage approved without resubmission or extra documentation
Rework rate: percentage that required resubmission, corrected codes, or added clinical documentation
Backlog: open authorizations older than 3, 7, and 14 days
The most revealing comparison in this list is queue time versus payer time. If your queue time is high, the delay is internal — and it's within your control to fix. If your payer time is high, the problem is external, but you can still manage it with better escalation and packet quality.
Most organizations discover both. Start with the internal piece.
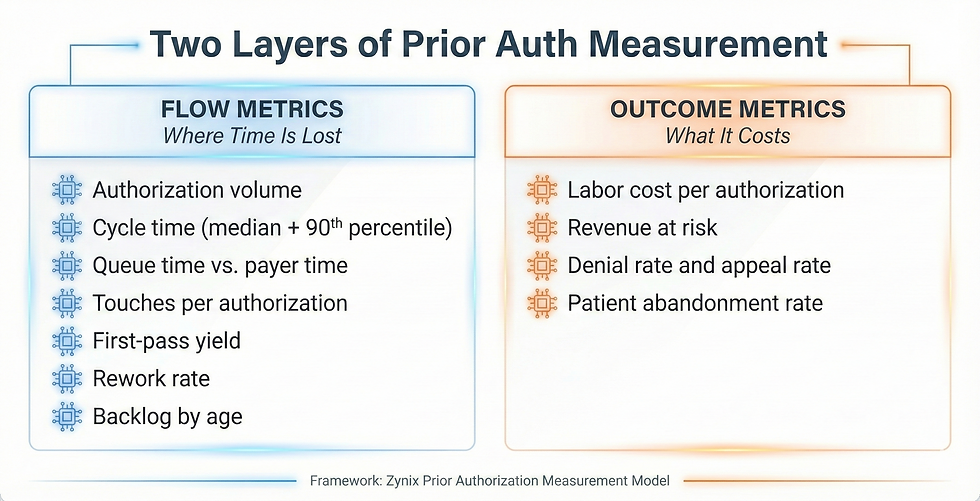
Outcome Metrics: The Language Your CFO and COO Speak
Once flow is visible, translate it into dollars and patient access.
Labor cost per authorization: (touch time in minutes ÷ 60) × blended hourly rate
Revenue at risk: dollars tied to appointments delayed or cancelled due to pending authorization
Denial rate and appeal rate: percentage denied, appealed, and overturned
Patient abandonment rate: percentage of orders that never resulted in a completed service
The CAQH 2024 Index estimates that fully adopting electronic prior authorization would save providers and staff 14 minutes per authorization — and save the industry $515 million annually.
Once you have these numbers, you're not talking about prior auth as a feeling anymore. You're talking about it as a system problem with a measurable cost and a measurable path to improvement. That's what survives the budget season.
How to Build a Real Baseline in 30 Days
You don't need perfect data to start. You need consistent definitions and the discipline to track a sample.
Step 1: Pick the Service Lines That Hurt the Most
Don't try to measure everything at once. Choose two or three service lines where delays are most visible and financially meaningful.
One high-volume line — to see scale
One high-dollar line — to see financial impact
One high-friction line — to see rework patterns
Most teams start with imaging and outpatient procedures, then add specialty medications or DME.
Step 2: Agree on Your Timestamps — Before Anything Else
This step gets skipped. It shouldn't. Consistency matters more than automation at this stage.
Order placed
Authorization created in your system
First submission to payer
First payer response
Final determination
Scheduled date
Completed date
Step 3: Build a Simple Touch Log
Most prior auth effort is invisible because it's scattered across phone calls, portal checks, and emails. A touch log makes it visible.
Log every human action that occurs on a request.
Portal submission
Portal status check
Phone call to payer
Fax sent
Fax received and scanned
Clinical documentation request to provider
Provider response received
Resubmission
Peer-to-peer scheduled
A shared spreadsheet works for 30 days. The goal is to find the hotspots: where touches cluster, and where work repeats.
Step 4: Segment by Payer and Service Line From Day One — Not Later
Averages hide the truth. A single payer's policy quirk can be responsible for half your backlog. If you wait to segment, you'll waste weeks looking at numbers that don't mean anything.
After 30 days, you'll have a real baseline. From there, you can set targets that are operationally meaningful: improve first-pass yield, cut touches per authorization, reduce the 90th percentile cycle time.
Where Delays Actually Start — and It's Often Not the Payer
Most teams assume the payer is the bottleneck. Sometimes that's true.
But in a lot of organizations, the delay starts internally — before the request even reaches the payer.
Internal Causes Are More Common Than Most Leaders Expect
The initial packet is incomplete: missing clinical notes, labs, imaging reports, or prior treatment history
Coding mismatch: diagnosis or procedure codes don't align with payer policy requirements
Order ambiguity: the order doesn't include the medical necessity language the payer expects
Provider response lag: signatures and peer-to-peer availability don't match payer timelines
No clear ownership: nobody knows who "owns" the request after it's submitted
No escalation rules: urgent cases wait in the same queue as routine ones
External Causes Are Real — But Easier to Quantify Once You've Fixed the Internal Ones
Multiple payer portals with inconsistent status transparency
The same service has different documentation requirements across plans
Certain service lines consistently fall into manual review queues
Denial rationale is too generic to act on without guessing
If your queue time is high, fix the internal process first. That is entirely within your control today.
What High-Performing Teams Do That Others Don't
Once measurement is in place, improvement usually comes from a small number of operational shifts. None are complicated. All require discipline.
They Make First-Pass Yield the North Star — Not Volume
The highest-leverage move is submitting a complete, correct packet the first time.
That means creating a minimum viable packet for each service line. Building a pre-submission checklist your staff can actually use. Requiring missing elements before submission, unless the case is clinically urgent. And maintaining a payer policy reference for your top ten plans.
Improving first-pass yield reduces cycle time, reduces rework, and reduces staff frustration — all at the same time.
They Run Prior Auth Like an Operations Center — Not a Pile of Inboxes
Prior auth breaks down when it's fragmented.
High-performing teams run it from a single queue view that shows backlog by age and service line. They do a daily triage with clear ownership. They have escalation triggers — for example, no payer response after 72 hours. They have a fast lane for urgent cases with documented clinical criteria.
It doesn't feel glamorous. It works.
They Separate Status Checks From Problem-Solving — Because Those Are Two Different Jobs
Most touches on a prior authorization are status checks. Checking a portal to see if anything changed isn't skilled work. It just takes up the time of people who are needed elsewhere.
Separate the two. Automate or systematize status monitoring. Keep your human staff focused on exceptions: missing documentation, denials, peer-to-peer preparation, appeal drafting.
They Treat Every Denial as a Specific Defect — Not an Inevitability
Every denial should be tagged as one of three types:
Medical necessity denial
Administrative or process denial
Eligibility or benefit denial
Then measure rework by category:
If administrative denials are high, the problem is packet quality and submission steps
If medical necessity denials are high, the problem is order documentation and clinical alignment
If eligibility denials are high, the problem is front-end verification
Denials you can categorize, you can reduce. Denials you can't categorize just keep coming back.
Where Automation Helps — and Where It Needs a Human Behind It
Prior authorization is a strong candidate for automation. It's repetitive, rules-driven, and full of low-value work. It's also high-risk if you automate the wrong parts.
The right approach: automate the repeatable work. Keep humans in charge of clinical judgment and exceptions.
Automation Works Well For These Steps
Assembling the clinical documentation packet from your EHR and records systems
Running a pre-submission checklist against payer policy requirements
Monitoring payer portal status and updating your queue without manual polling
Routing exceptions to the right person with a clear deadline
Drafting structured appeal narratives for clinician review and sign-off
These Guardrails Are Not Optional — They're Compliance Requirements
Full audit logs of every action and status change, readable weeks later if needed
Human review before any clinical rationale or appeal language is sent
Role-based access and PHI controls on every touchpoint
No auto-approval or auto-denial behavior on the provider side
The goal isn't automation everywhere. The goal is fewer touches, faster cycle time, and fewer preventable denials.
ZynixAuth agents are built for exactly this lane — reducing the manual chase work, tightening packet quality before first submission, and keeping your team's attention on the exceptions that actually require clinical judgment.
Start Here — One Baseline, One Target, One Month
If prior auth delays feel like a constant drain, you're not imagining it.
They behave like a system with hidden queues and rework loops. Until you measure those loops, you can't fix them. And most organizations never measure them — they just keep absorbing the cost.
Start with a 30-day baseline. Segment by payer and service line. Track touches and rework. Then pick one improvement target: first-pass yield, backlog reduction, or 90th percentile cycle time.
Once the numbers are visible, the path forward gets calmer. You can decide what to standardize, what to staff differently, and what to automate — with evidence, not instinct.
The teams that reduce authorization cycle time significantly this year won't do it by adding headcount. They'll do it by measuring first. The question is whether your organization is ready to start with that baseline — before it tries to automate anything.
If you want to see how ZynixAuth handles status monitoring, packet assembly, and escalation routing in practice — using the same framework described in this post — [Schedule a demo].


Comments